9. Processing CEDAR Exports
9.1. Overview
This section provides instructions for processing CEDAR exports (queries, timber), so that they can be used to populate the iAM.AMR models.
This processing is performed using the sawmill R package. If you are not familiar with sawmill, please review the section on sawmill, and install it as per the instructions on that page before continuing.
Tip
This section should be read concurrently with the last step of your chosen installation procedure (Bootstrap or Standard): please see the Installation and Use section of the sawmill GitHub repository’s README instruction file).
9.2. Raw Timber
CEDAR timber should be in the form of an Excel (.xlsx) file, where each row represents an individual factor.
The following table is an example of a properly formatted input timber file (header row and one example factor row are shown).
| RWID | ident_doi | ident_pmid | name_bibtex | ID_factor | AMR | factor_title | factor_description | host_01 | host_02 | microbe_01 | microbe_02 | stage_allocate | stage_observe | group_exposed | group_referent | res_format | res_unit | contable_a | contable_b | contable_c | contable_d | prevtable_a | prevtable_b | prevtable_c | prevtable_d | table_n_exp | table_n_ref | odds_ratio | odds_ratio_lo | odds_ratio_up | odds_ratio_sig | odds_ratio_confidence | ID_meta | meta_amr | meta_type |
|---|---|---|---|---|---|---|---|---|---|---|---|---|---|---|---|---|---|---|---|---|---|---|---|---|---|---|---|---|---|---|---|---|---|---|---|
| 13826 | 10.1016/j.vetmic.2007.05.025 | Thakur2007 | 10180 | tetracycline | Antimicrobial-free production system type | Intensive (indoor) vs extensive (outdoor) production system type. Indoor = single pen (space of 2.4 ft^2/pig at nursery and 7.4 ft^2/pig at finishing). Outdoor = uncovered barricaded area. Isolates taken at pre-evisceration stage. | Swine | Carcass | Salmonella | spp. | Farm | Abattoir | Outdoor | Indoor | Contingency Table | Isolate | 17 | 5 | 43 | 5 | 95 |
Attention
The left-to-right order and names of the fields in your input file must match that shown above exactly, otherwise sawmill will raise an error.
Each field has an expected data type, as dictated below. A description of each field is also provided.
| Field Name | Expected Data Type | Field Description |
|---|---|---|
| RWID | text | RefWorks ID for the reference |
| ident_doi | text | DOI for the reference |
| ident_pmid | text | PMID for the reference |
| name_bibtex | text | First author + publication date of reference |
| ID_factor | numeric | ID of the factor |
| AMR | text | Antimicrobial assayed for resistance for the factor in question |
| factor_title | text | Factor title |
| factor_description | text | Factor description |
| host_01 | text | Host involved (i.e. cattle, swine) |
| host_02 | text | Specific host involved (i.e. dairy cows, beef calves) |
| microbe_01 | text | Microbe genus involved (i.e. Escherichia, Salmonella) |
| microbe_02 | text | Microbe species involved (i.e. coli, spp.) |
| stage_allocate | text | Stage of production at which the intervention to the exposed group is made in the study |
| stage_observe | text | Stage of production at which the intervention’s effect is measured in the study |
| group_exposed | text | Description of the exposed group |
| group_referent | text | Description of the referent group |
| res_format | text | Set of result fields available in the study (i.e. Contingency Table, Prevalence Table) |
| res_unit | text | Unit to which the results apply (i.e. flock, isolate, pooled isolate) |
| contable_a | numeric | Contingency Table: # AMR+ in exposed group |
| contable_b | numeric | Contingency Table: # AMR- in exposed group |
| contable_c | numeric | Contingency Table: # AMR+ in referent group |
| contable_d | numeric | Contingency Table: # AMR- in referent group |
| prevtable_a | numeric | Prevalence Table: % AMR+ in exposed group |
| prevtable_b | numeric | Prevalence Table: % AMR- in exposed group |
| prevtable_c | numeric | Prevalence Table: % AMR+ in referent group |
| prevtable_d | numeric | Prevalence Table: % AMR- in referent group |
| table_n_exp | numeric | Total # [res_unit] in exposed group |
| table_n_ref | numeric | Total # [res_unit] in referent group |
| odds_ratio | numeric | Odds Ratio: Odds ratio value for the factor |
| odds_ratio_lo | numeric | Odds Ratio: Lower bound of the confidence interval |
| odds_ratio_up | numeric | Odds Ratio: Upper bound of the confidence interval |
| odds_ratio_sig | text | Odds Ratio: Significance value (p-value) |
| odds_ratio_confidence | numeric | Odds Ratio: The confidence interval (i.e. 95%) |
| ID_meta | text | Meta-analysis: ID of the meta-analysis group to which the factor belongs (if applicable) |
| meta_amr | text | Meta-analysis: antimicrobial/class of antimicrobials to which resistance was assayed in the factors included in this particular meta-analysis group (if applicable) |
| meta_type | text | Meta-analysis: type/level of granularity of this particular meta-analysis group (i.e. within studies, across studies) (if applicable) |
Attention
The type of data contained within each of the fields in your input file should match those outlined above, as processing errors can occur otherwise. Please see Warnings due to unexpected data types for more information.
9.3. Using sawmill
9.3.1. Changing default values of sawmill arguments
Tip
This sub-section is optional if you have chosen the Bootstrap installation.
Complete descriptions of these arguments and guides as to how they should be changed can be found in the Sawmill Arguments section of the sawmill GitHub repository’s README.md file.
To change these arguments, open start_mill.R and mill.R. The default values are specified in this script in a single line of code, as shown for mill.R in the following figure.
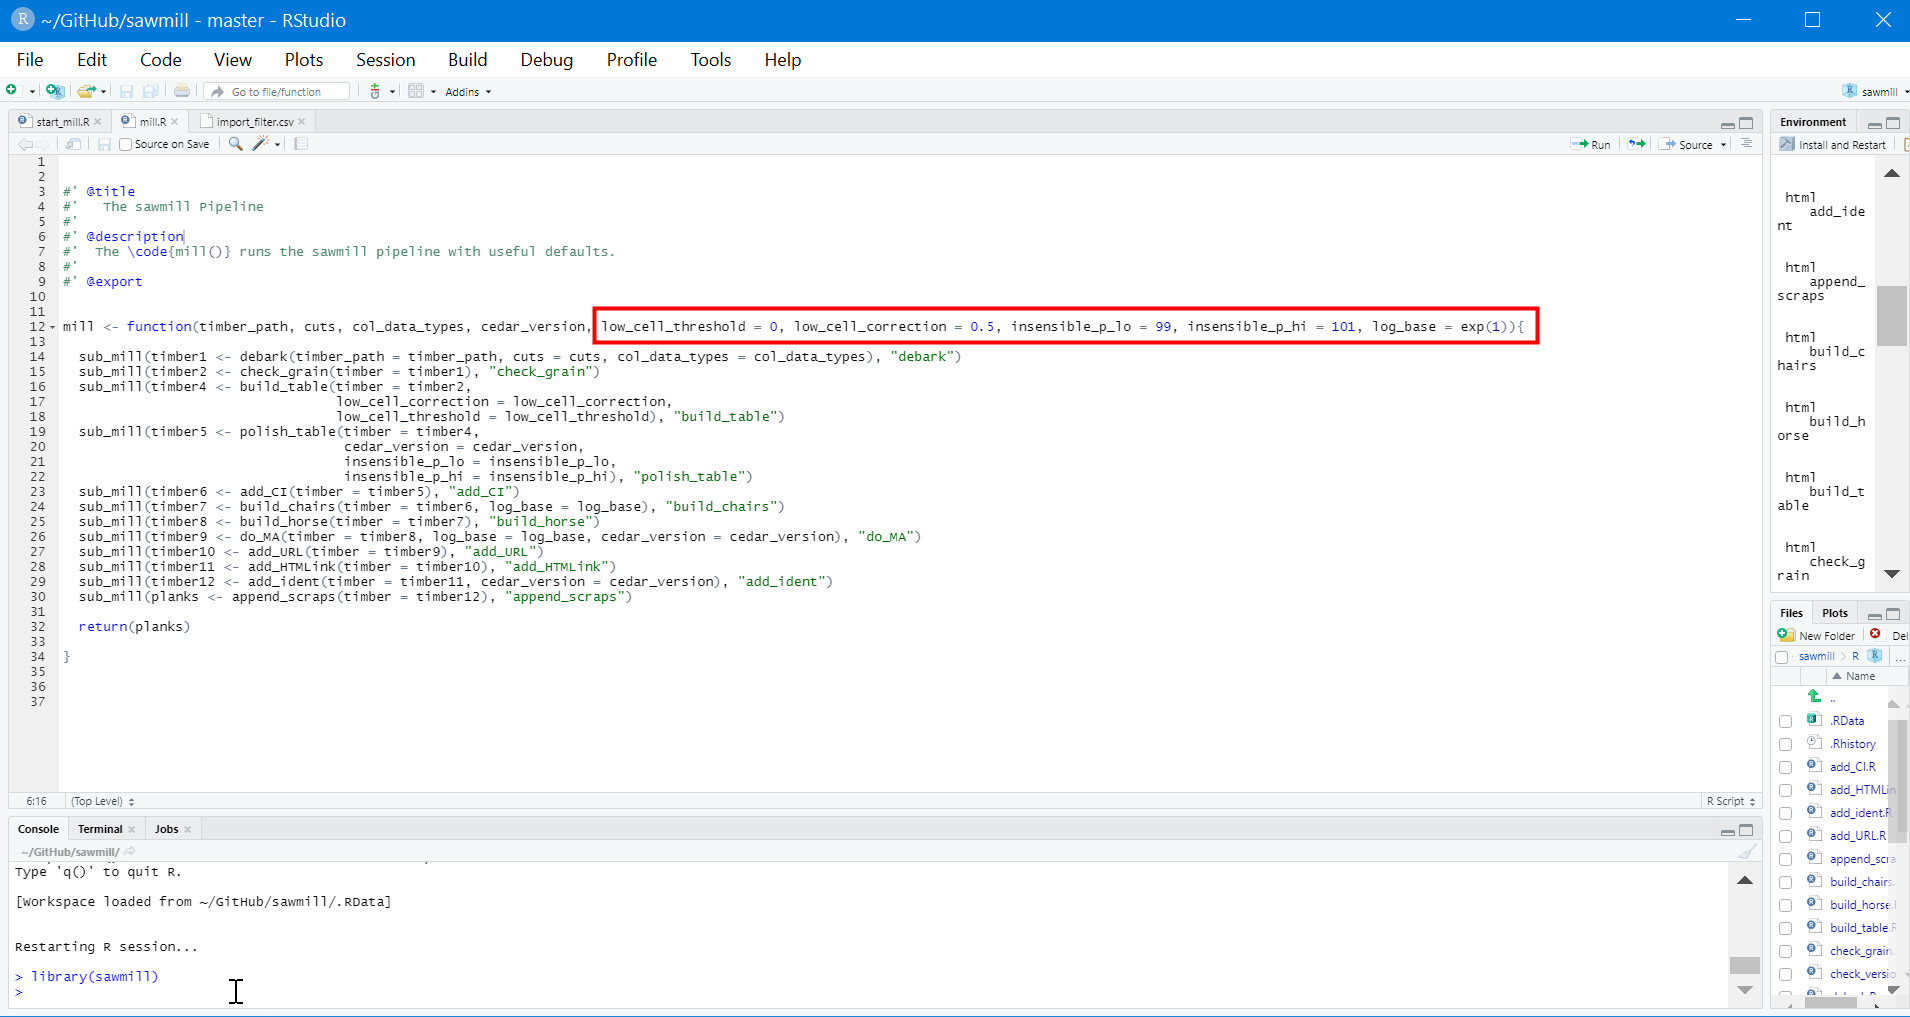
Default arguments in sawmill’s mill.R script.
The argument values can be changed directly in this line of code. For example, if you wanted to change the argument insensible_p_lo to 98, simply replace the 99 after the = sign with 98.
Attention
You must click Install and Restart in the Build tab of RStudio for any changes to the code to take effect.
9.3.2. Adding meta-analysis groupings
Upon examining the processed timber, you may wish to group certain factors together for meta-analysis in the raw timber and rerun sawmill.
Attention
Meta-analysis is currently only supported for timber from CEDAR v2.
To add a meta-analysis grouping, make the following changes to the optional meta-analysis fields in the original, raw timber file:
- ID_meta: assign the same meta-analysis ID to all factors you wish to include in the grouping
- meta_amr: specify the antimicrobial or class of antimicrobials to which resistance is assayed
- meta_type: describe the type and level of granularity of the meta-analysis grouping
Tip
The actual meta-analysis ID assigned to a particular grouping is irrelevant, as long as it is consistent across all factors in the grouping.
The table below provides example values for each meta-analysis field, as they might appear for a factor in the raw timber.
| ID_meta | meta_amr | meta_type |
|---|---|---|
| 7 | third-generation cephalosporin | Within Study, Same Antimicrobial Class |
All three meta-analysis fields (ID_meta, meta_amr, and meta_type) can simply be left blank for factors that should not be involved in meta-analysis calculations.
9.3.3. Running sawmill
Please see the instructions in the Installation and Use section of the GitHub repository’s README.md file.
Prompts will appear in the Console as you follow the instructions from GitHub. Enter the information requested by the prompts and select the input timber file from its saved location on your computer.
Once sawmill is finished running, it will prompt you to save one or more output files. For each one, you will be prompted to select the save location on your computer.
Important
Save all output files with .csv extensions to prevent errors from occurring.
If errors or warnings appear, please see the following sub-sections.
Caution
You will likely rerun sawmill many times, as deciding which factors to include in a model is an iterative process. You will need to enter the command rm(list = ls()) into the Console before rerunning sawmill. This must be done once for every rerun. This way, variables saved during sawmill’s previous run will not carry over to the new one.
9.3.4. Errors
Errors will stop sawmill from continuing to run, at whichever point in the pipeline they are raised.
An error message will appear in the Console, indicating which function caused the error. For example, if the error is raised in the build_chairs function, the message will look something like the following:
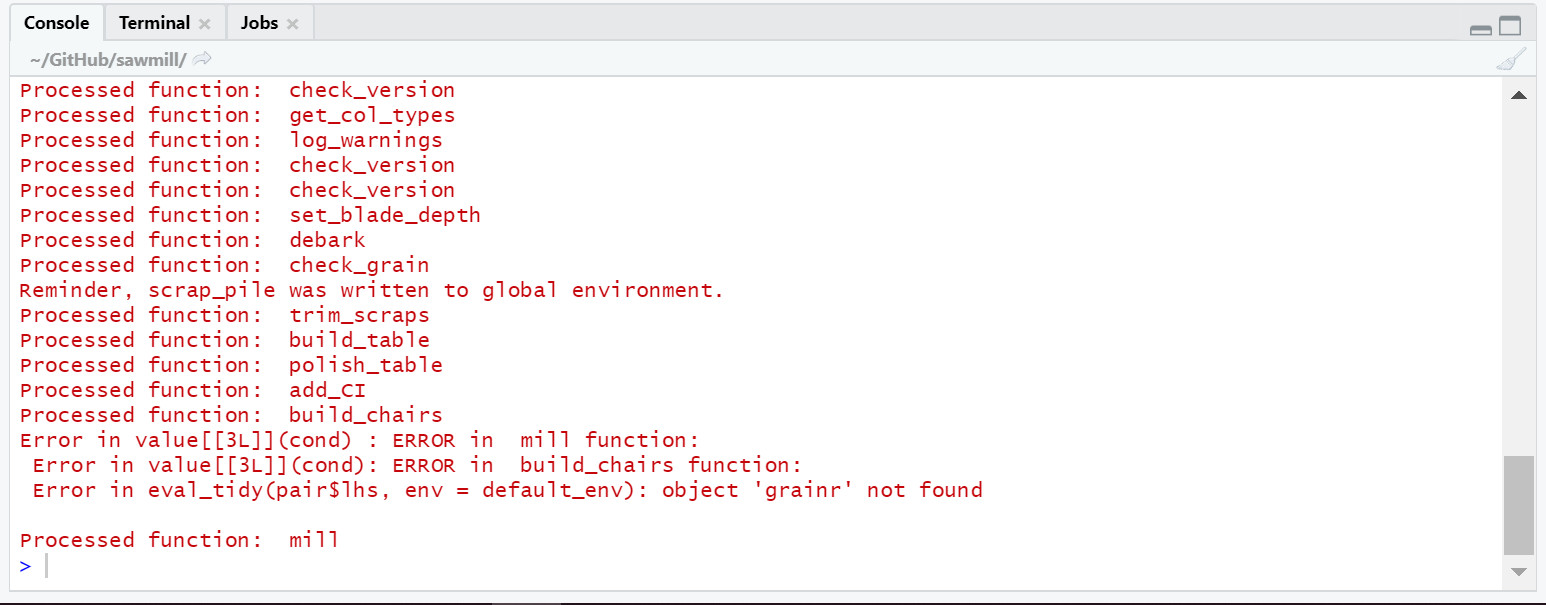
Example error message.
Please note that only the lines beginning with “Error” constitute the actual error message. Although the “Processed function…” lines are also in red text, they should be present in the case of a normal output (i.e. one without errors or warnings).
Important
In the event of an error, please send the error message and input timber file that produced it to the maintainer of sawmill’s GitHub repository.
9.3.5. Warnings
Warnings alert the user to potential problems with the code or input data.
Their presence can indicate that sawmill may run into an error at a later step in the processing pipeline, or simply that the current code or input data will produce an incorrect output without further warning. Others may mean nothing; sawmill may continue to execute flawlessly.
Warnings do not stop the pipeline at the point they are raised, but they are still worth examining.
9.3.5.1. Warnings due to unexpected data types
If sawmill detects that one or more cells in the input timber file do not match the expected data types for their respective columns, a warning message will be generated for each mismatching cell. The warning messages are informative; they specify the exact cell addresses within your input file that contain data of the unexpected type.
These particular warnings will also generate a prompt asking whether you would like to stop the pipeline and fix your input data, or continue with processing anyway.
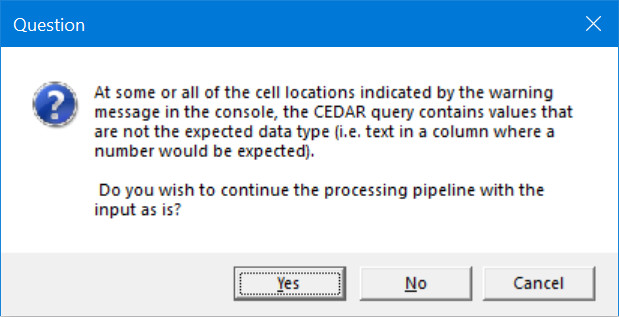
Warning prompt.
Caution
Electing to continue with processing when faced with this prompt can create unwanted/unexpected results, which you may not receive further warning about.
The type of warning received (Coercing or Expecting) can help you decide whether or not you should continue.
9.3.5.1.1. Coercing warnings
Coercing warnings appear when R is able to convert the affected cell(s) to the appropriate, expected data type(s).
Below is an example of a cell that is likely to produce a coercing warning. This value is in the odds_ratio_up column, so its data type should be numeric. While the value is a number, it is formatted as text (flagged by Excel in the upper left corner of the cell).
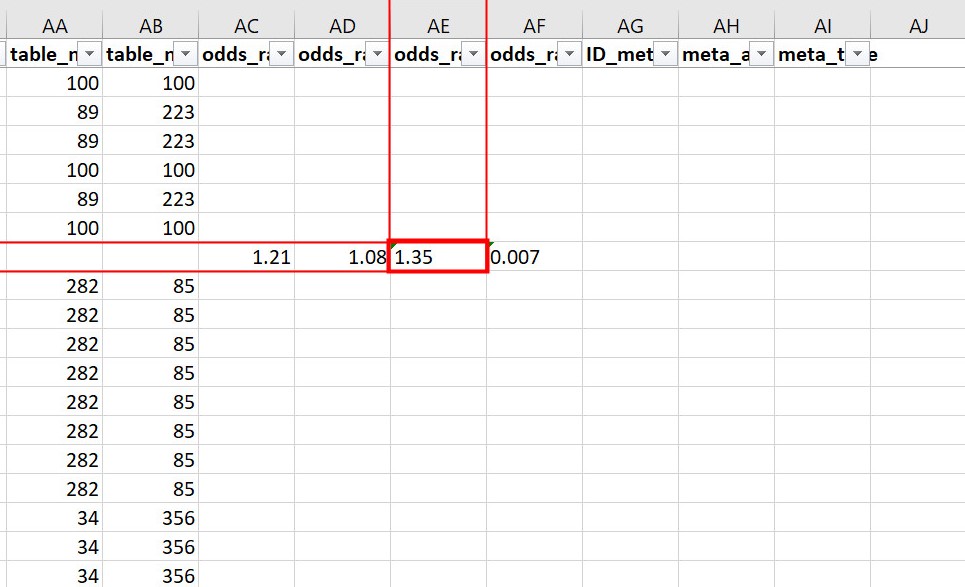
Example of a cell that produces a coercing warning.
Warning messages for coercing warnings appear in the Console and look something like that shown below. The Excel cell shown above produced one of these warnings (the one affecting AE524 / R524C31).

Coercing warning examples.
If only coercing warnings are present, you can safely choose to continue with processing when faced with the prompt.
9.3.5.1.2. Expecting warnings
Expecting warnings appear when R is not able to convert the affected cell(s) to the appropriate, expected data type(s).
Below is an example of a cell that is likely to produce an expecting warning. This value is in the prev_table_d column, so its data type should be numeric. However, a text string is present, and it cannot be converted to a numeric data type.
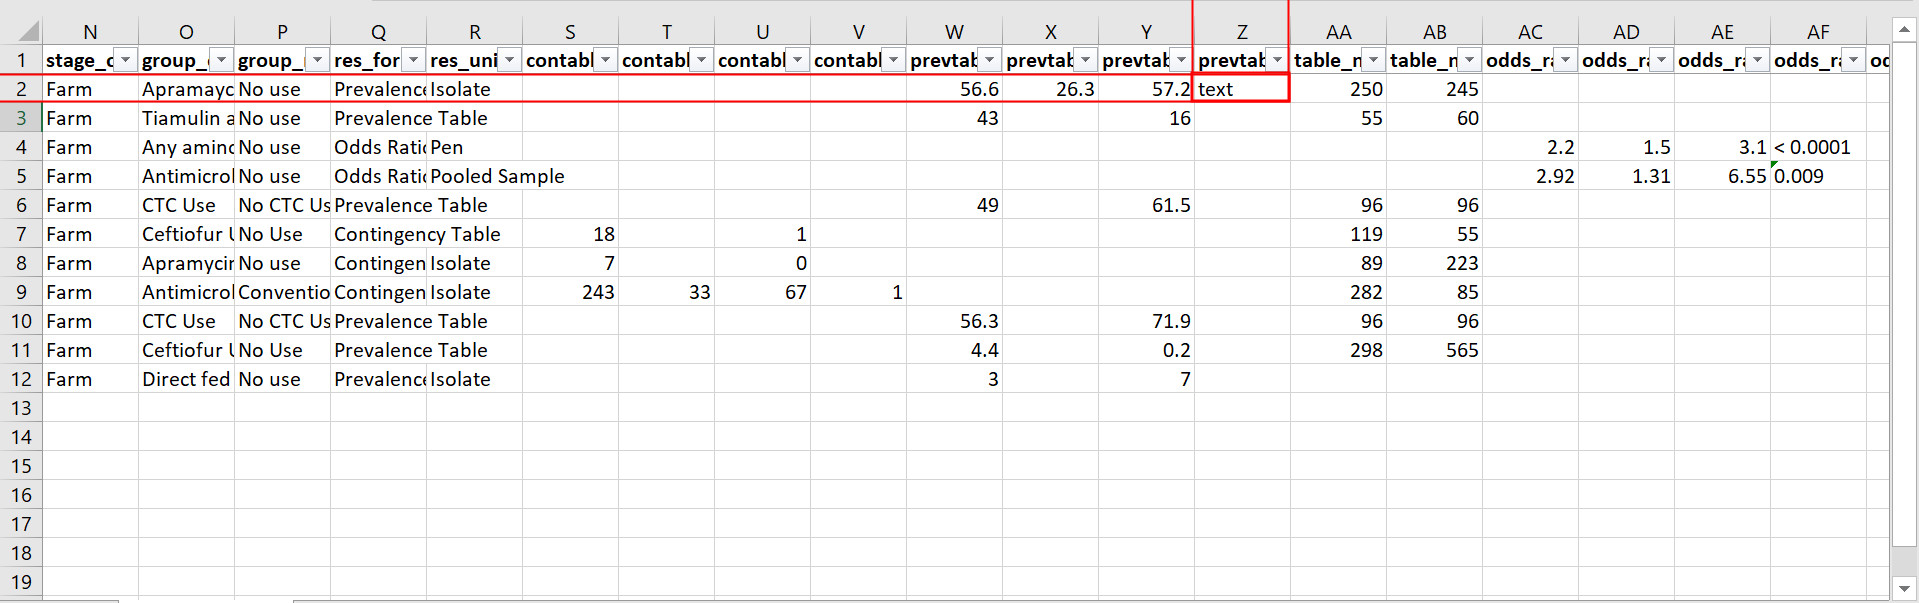
Example of a cell that produces an expecting warning.
Warning messages for expecting warnings appear in the Console and look something like that shown below. The Excel cell shown above produced this warning; it affects cell Z2 / R2C26.
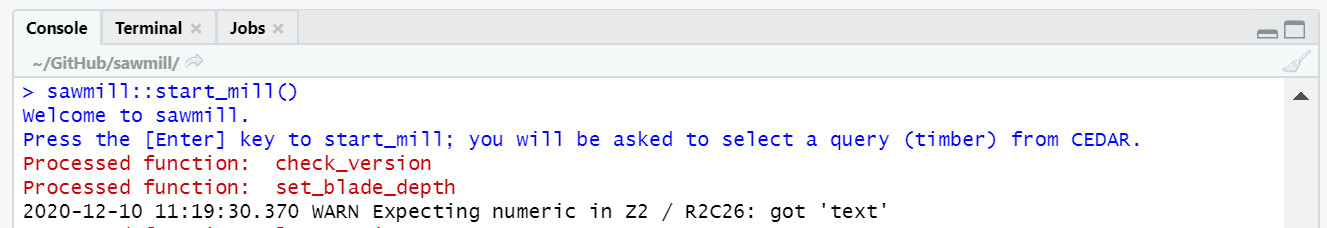
Expecting warning example.
The implications of expecting warnings vary depending on the columns in which they occur.
If the affected cell(s) are in any of the columns specified in the table below, you should stop the pipeline and fix the affected cells. These fields have a direct effect on the odds ratio calculation, so in the event of unexpected data types in any of these, sawmill will typically deem the factor unusable, excluding the row from further processing and writing it to the scrap pile without warning.
| CEDAR v1 Field Name | CEDAR v2 Field Name |
|---|---|
| result_format | res_format |
| tbl_a | contable_a |
| tbl_b | contable_b |
| tbl_c | contable_c |
| tbl_d | contable_d |
| tbl_p | prevtable_a |
| prevtable_b | |
| tbl_q | prevtable_c |
| prevtable_d | |
| tbl_m1 | table_n_exp |
| tbl_m2 | table_n_ref |
| factor_or | odds_ratio |
| or_lo | odds_ratio_lo |
| or_up | odds_ratio_up |
If the affected cell(s) are in any of the other columns, however, sawmill will simply replace the cell with a value of NA. The factor will not be deleted, and the row will still appear in the processed timber. In cases like this, it is up to the user whether or not to continue with processing when faced with the prompt.
Attention
Output fields may still be affected by unexpected data types in these other columns. For instance, the url and html_link output columns are affected by ident_doi (v2)/docID (v1), and sometimes ident_pmid (v2). Also, the identifier output column is affected by ID_factor (v2)/ID (v1) and factor_title (v2)/title (v1).
9.3.5.2. Other warnings
Every time you execute sawmill, you will likely see a message resembling the following in the Console, once the pipeline has finished and you have saved your processed timber.

Generic warnings alert.
If you follow the prompt by entering the following into the Console:
warnings()
You will see something closely resembling the following:
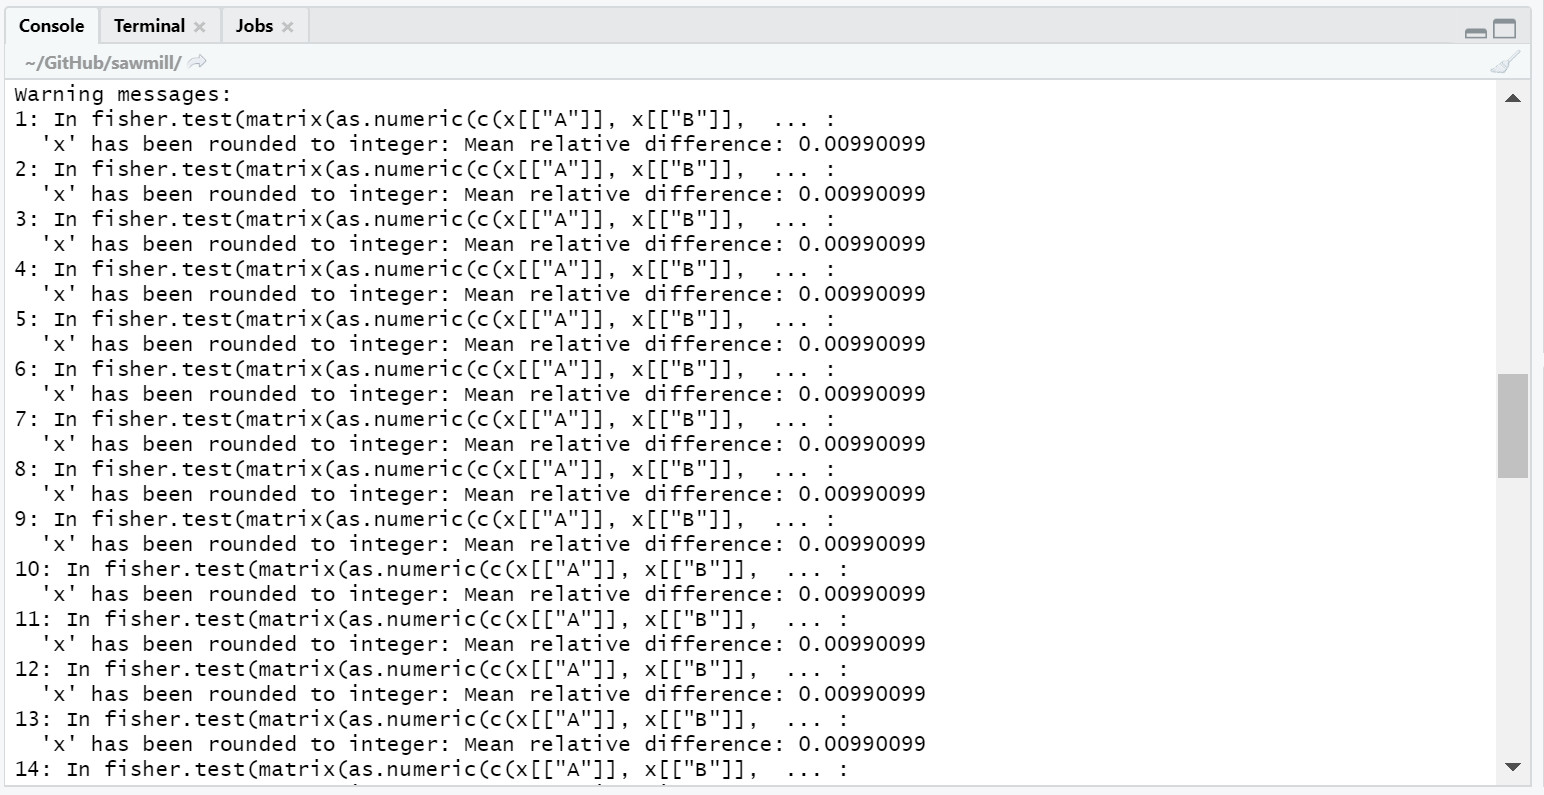
Generic warning messages.
This type of warning can be ignored. It occurs when the significance value (p-value) for the factor is calculated using the Fisher’s exact test. Since the values used in the Fisher’s test must be rounded to the nearest integer, a warning is generated to notify the user that the rounding took place.
Attention
If the warning messages are of any other nature than those mentioned, please contact the maintainer of sawmill’s GitHub repository for assistance.
9.4. Evaluating the Processed Timber (Planks) and Other Outputs
This section outlines the fields that will be present in the processed timber .csv file. Each row now represents a plank of processed timber, or a factor usable for an iAM.AMR model.
An overview of additional output .csv files that may be produced is also provided.
9.4.1. The output .csv files
9.4.1.1. Processed timber
A processed timber file is produced for each successful run of sawmill.
Two types of planks (rows) are present in the following order, from top to bottom:
- Error-free factors for which an odds ratio and other outputs were successfully calculated
- Meta-analysis results for each meta-analysis grouping (each unique meta-analysis ID)
Note
Rows containing the results of a meta-analysis will look slightly different (for instance, some fields may have values of NA).
9.4.1.2. Scrap pile
This file is only provided as an output if there is at least one erroneous factor in the raw timber.
The scrap pile contains all erroneous factors, or factors for which an odds ratio and other key outputs were not successfully calculated.
Its fields are overall quite similar to those present in the raw timber, with two unique additions:
- exclude_sawmill: Flagged as TRUE, indicating that the factor was excluded from calculations by sawmill due to errors/missing data
- exclude_sawmill_reason: A more detailed description of why the factor was not usable
9.4.1.3. Full meta-analysis results
This file is only provided as an output if there is at least one meta-analysis grouping in the raw timber.
Each row represents the results from a single meta-analysis grouping, indicated by the value of ID_meta in the far-left column.
The main estimates produced by the meta-analysis calculation (odds ratio, standard error of the log(odds ratio), and p-value) are included in the processed timber. However, the full results produced by metafor (the meta-analysis R package used by sawmill), contain many more fields describing other parameters of the calculation.
For a full description of these parameters, please see pg. 241 of the metafor user guide, which is the Value list for rma.uni.
9.4.2. Planks
The following table is an example of processed timber.
While all fields present in the input timber are retained in the output, some will have new names. Sawmill renames some of the fields to improve uniformity between v1 and v2 outputs.
| ID | RWID | identifier | factor_title | factor_description | ref_key | html_link | group_exposed | group_referent | odds_ratio | se_log_or | pval | logOR | ID_meta | meta_amr | meta_type | AMR | host_01 | host_02 | microbe_01 | microbe_02 | stage_allocate | stage_observe | res_unit | res_format | grain | A | B | C | D | P | R | Q | S | nexp | nref | odds | oddslo | oddsup | oddsig | oddsci | low_cell_count | null_comparison | insensible_prev_table | doi | pmid | url |
|---|---|---|---|---|---|---|---|---|---|---|---|---|---|---|---|---|---|---|---|---|---|---|---|---|---|---|---|---|---|---|---|---|---|---|---|---|---|---|---|---|---|---|---|---|---|---|
| 10002 | 10723 | R10002_Apramaycin_su | Apramaycin sulfate, carbadox, and chlortetracycline hydroxchloride use | All used as feed additives. Apramaycin sulfate: 150 g/ton as Apralan 7; 5 lb/pig at weaning. Carbadox: 50 g/ton as Mecadox 2.5; about 15 lb/pig. Chlortetracycline hydroxchloride: 250 g/ton; 14 days ad libitum. | Kim2005 | <a href=”http://dx.doi.org/10.1089/fpd.2005.2.304”>Click Here</a> | Apramaycin sulfate, carbadox, and chlortetracycline hydroxchloride use | No use | 0.986111111 | 0.181571417 | 1 | -0.013986242 | NA | NA | NA | tetracycline | Swine | Piglets | Escherichia | coli | Farm | Farm | Isolate | Prevalence Table | prev_table_pos_tot | 142 | 108 | 140 | 105 | 56.6 | 26.3 | 57.2 | 38 | 250 | 245 | NA | NA | NA | NA | 95 | FALSE | FALSE | TRUE | 10.1089/fpd.2005.2.304 | NA | http://dx.doi.org/10.1089/fpd.2005.2.304 |
A description of each output field is provided below. The fields which are added by sawmill and thus only appear in the processed timber are also annotated with the function responsible for adding them.
Tip
The odds_ratio, se_log_or, and pval fields are added by the do_MA function in cases where the row contains the results of a meta-analysis.
Tip
The logOR field is only added if there is at least one meta-analysis grouping (one unique meta-analysis ID) in the raw timber.
| Field Name | Field Description | Added to Output by Function __ |
|---|---|---|
| ID | ID of the factor | |
| RWID | RefWorks ID for the reference | |
| identifier | Unique identifier for this factor, for Analytica | add_ident |
| factor_title | Factor title | |
| factor_description | Factor description | |
| ref_key | First author + publication date of reference | |
| html_link | HTML link to the reference study | add_HTMLink |
| group_exposed | Description of the exposed group | |
| group_referent | Description of the referent group | |
| odds_ratio | Final odds ratio (either copied from odds field if provided, or calculated) | build_chairs |
| se_log_or | Standard error of the log(odds ratio) | build_chairs |
| pval | Significance value (p-value, either copied from oddsig field if the grain is odds_ratio, or calculated for other grains) | build_horse |
| logOR | Log of the final odds ratio | do_MA |
| ID_meta | Meta-analysis: ID of the meta-analysis group to which the factor belongs (if applicable) | |
| meta_amr | Meta-analysis: antimicrobial/class of antimicrobials to which resistance was assayed in the factors included in this particular meta-analysis group (if applicable) | |
| meta_type | Meta-analysis: type/level of granularity of this particular meta-analysis group (i.e. within studies, across studies) (if applicable) | |
| AMR | Antimicrobial assayed for resistance for the factor in question | |
| host_01 | Host involved (i.e. cattle, swine) | |
| host_02 | Specific host involved (i.e. dairy cows, beef calves) | |
| microbe_01 | Microbe genus involved (i.e. Escherichia, Salmonella) | |
| microbe_02 | Microbe species involved (i.e. coli, spp.) | |
| stage_allocate | Stage of production at which the intervention to the exposed group is made in the study | |
| stage_observe | Stage of production at which the intervention’s effect is measured in the study | |
| res_unit | Unit to which the results apply (i.e. flock, isolate, pooled isolate) | |
| res_format | Set of result fields available in the study (i.e. Contingency Table, Prevalence Table) | |
| grain | Set of result fields provided in the study (i.e. if A, B, C, and D are provided, the grain is con_table_pos_neg) | check_grain |
| A | Contingency Table: # AMR+ in exposed group | |
| B | Contingency Table: # AMR- in exposed group | |
| C | Contingency Table: # AMR+ in referent group | |
| D | Contingency Table: # AMR- in referent group | |
| P | Prevalence Table: % AMR+ in exposed group | |
| R | Prevalence Table: % AMR- in exposed group | |
| Q | Prevalence Table: % AMR+ in referent group | |
| S | Prevalence Table: % AMR- in referent group | |
| nexp | Total # [res_unit] in exposed group | |
| nref | Total # [res_unit] in referent group | |
| odds | Odds Ratio: Odds ratio value for the factor | |
| oddslo | Odds Ratio: Lower bound of the confidence interval | |
| oddsup | Odds Ratio: Upper bound of the confidence interval | |
| oddsig | Odds Ratio: Significance value (p-value) | |
| oddsci | Odds Ratio: The confidence interval (i.e. 95%) | add_CI |
| low_cell_count | If TRUE, at least one of A, B, C, or D is less than or equal to the low_cell_threshold and a correction factor was applied to A, B, C, and D | build_table |
| null_comparison | If TRUE, both A and C are equal to 0 (meaning that no AMR+ observations were made) | build_table |
| insensible_prev_table | If TRUE, the grain is prev_table_pos_tot and the values in the prevalence table do not add up to 100 where they should | polish_table |
| doi | DOI for the reference | |
| pmid | PMID for the reference | |
| url | URL to the reference study | add_URL |
9.4.3. Checking the validation fields
These are present in the processed timber file.
9.4.3.1. Low cell count factors
When one or more of the four values in the 2x2 contingency table is equal to zero, sawmill sets the low_cell_count field to True. To avoid divide by zero errors, sawmill increments all four values by 0.5.
9.4.3.2. Null comparison factors
When the # AMR+ observations in both the exposed and referent groups are equal to zero, sawmill sets the null_comparison field to True. To avoid divide by zero errors, sawmill increments all four values by 0.5.
Any null comparison factors also have the low_cell_count field set to True.
9.4.3.3. CEDAR v2: factors with an insensible_prev_table
Check your output .csv file for rows where the insensible_prev_table field is set to True. These rows likely have data entry errors in the prevalence table columns, as this result indicates that (% AMR+ exposed) + (% AMR- exposed) does not come to approximately 100, and/or that (% AMR+ referent) + (% AMR- referent) does not come to approximately 100.