3. Data Extraction Rules
3.1. Data Extraction Rules
3.1.1. Immutable Factors
Immutable factors are defined as those that are not practically modifiable or reproducible. These include factors such as:
- unique comparison groups or locations
- Barn A vs. Barn B
- Sweden vs. Switzerland
- breed or type of animal
- Ross chicks vs. Cobb chicks
- Swedish Friesian vs. Swiss Holsteins
- life stage or production stage
- egg vs. chick vs. broiler
- grow-finish vs. farrow-to-finish
- farm vs. abattoir vs. retail
- unique years/periods of time
- 1998 vs. 1999
- size of herd of origin
- small vs. large
Note that factors which assess the same animals before and after AMU are acceptable.
Immutable factors should not be extracted.
Important
If a reason for the comparison is given, such as a growth promoter ban/change in related industry policy, factors comparing unique years/periods of time may be valid for extraction. See Antimicrobial ban factors.
3.1.2. Common Factor Types
To compare conventional, ABF, organic, ‘welfare’ or ‘humane’ production systems, note that these alternative systems are not the same. While all organic is ABF (antibiotic-free), not all ABF is organic. ‘Welfare’ and ‘humane’ production systems are likewise different.
3.1.3. Selective Media
3.1.3.1. About Selective Media
A growth medium (plural media) or culture medium is a fluid designed to support the growth of microorganisms. There are many different types of media; some examples related to the iAM.AMR project include: MacConkey agar (for gram-negative bacteria), and XLD agar (commonly used for Salmonella spp.).
When compounds are added to media to select for the growth of specific organisms, it is referred to as selective media. However, it is important to differentiate the uses of selective media in the context of Antimicrobial Susceptibility Testing (AST):
- to broadly exclude unwanted organisms
- to select for desired organisms
- as a simple AST
Selective media are routinely used to broadly exclude unwanted organisms (purpose 1). For example, MacConkey agar is used to exclude gram-positive organisms when culturing gram-negatives. And media supplemented with third-generation cephalosporins (3GCs) are used to exclude other, faster-growing organisms while culturing Campylobacter spp.
Note
This is an important example to note. Campylobacter are considered intrinsically resistant to 3GCs. The use of 3GCs is not selecting for Campylobacter based on this resistance – it’s excluding other, non-resistant organisms. This is in contrast to the example below, where fluoroquinolones are used to select for specific Campylobacter.
Selective media can also be used to select for specific organisms based upon a specific trait, such as antimicrobial resistance (purpose 2). In contrast to the previous example, we could add a fluoroquinolone to the medium to select for only fluoroquinolone-resistant Campylobacter – susceptible Campylobacter will be inhibited by the antimicrobial.
Finally, selective media can be used as an AST in and of itself (purpose 3). Adding a suspect organism to selective media (and watching to see if it grows) can answer binary questions (e.g. is this organism resistant?). This gives no information on the level of resistance. To determine the level of resistance, this process must be repeated with various levels of selective compound (akin to broth dilution methodologies).
3.1.3.2. Selective Media in CEDAR
- In the context of data extraction, we only consider “selective media” as used for purpose 2: to select for desired organisms.
- As per our data extraction rules, we prefer results from non-selective media where available.
- There is a separate field for indicating where selective media are used for growth/culture, and for the AST itself (which can also be via selective media, as described above).
Hint
Another way to think of this distinction: we only consider media “selective“ in the context of data extraction where the added compound could differentiate between organisms of the same species, based on an acquired resistance.
3.1.4. Binary and Continuous Factors
When a factor is binary (i.e. two discrete outcomes, such as “Yes” and “No”), it shall be extracted.
When a factor is continuous (e.g. a one unit increase in the predictor results in an X unit increase in the outcome) it shall not be extracted.
3.1.4.1. Selecting a Referent Level
Binary factors consist of a referent and exposure group (e.g. your control and exposure groups respectively). The referent should generally be defined as the default practice in industry, or the least interventionist, while the exposure is the less common, or more interventionist approach. See above for more details.
3.1.4.2. Multiple Discrete Levels (Categories)
When a factor has multiple levels (e.g. low, medium, and high), the factor shall be extracted seperately for each level, using the same referent level.
For example, for a factor with levels low, medium, and high, the factor is extracted as low vs. medium, and low vs. high. The factor medium vs. high shall not eb extracted. The choice of referent level is described above.
3.1.4.2.1. Non-informative Levels
An exception is non-informative levels, which shall not be extracted.
For example, for a factor with levels ‘red’, ‘blue’, and ‘other’, the factor is only extracted as red vs. blue, because the ‘other’ is not part of a defined set, and cannot be inferred from the comparison. But, where levels are drawn from a defined set, they shall be extracted (these are few and far-between). For example, for a factor with levels ‘summer’, ‘winter’, ‘other’, the factor is extracted as ‘summer’ vs. ‘winter’ and ‘summer’ vs. ‘other’, as the ‘other’ can be inferred.
3.1.5. Factor Data
When multiple data formats are available, we always prefer contingency tables (count data), followed by prevalence tables, and finally odds ratios or relative risk. You only need to extract one format of data for a given factor.
If data is only presented as relative risk we cannot use relative risk at this time so do not extract the factor’s data, but indicate the omission in the notes field.
If data are presented as odds ratios, extract those from univariable analyses, but not those from multi-variable analyses. If the results are in log(Odds) or an estimate/coefficient of a logistic regression, recall that the Odds Ratio = e^x, where x is the coefficient.
In cases where there are zero observations of resistance in both the exposed and referent groups, corresponding values may be omitted from tables but still mentioned in-text. Such “non-significant” values should still be extracted.
If a study includes an ‘Intermediate’ category, add the intermediate isolates/prevalence to the resistant category (i.e. we round up intermediate to resistant).
3.1.6. Figure Extraction Using WebPlotDigitizer
If the factor data are only available in a figure, it may be possible to extract the data with the use of WebPlotDigitizer. Here is the link to the website https://apps.automeris.io/wpd/.
This is what you will see when you go to the website:
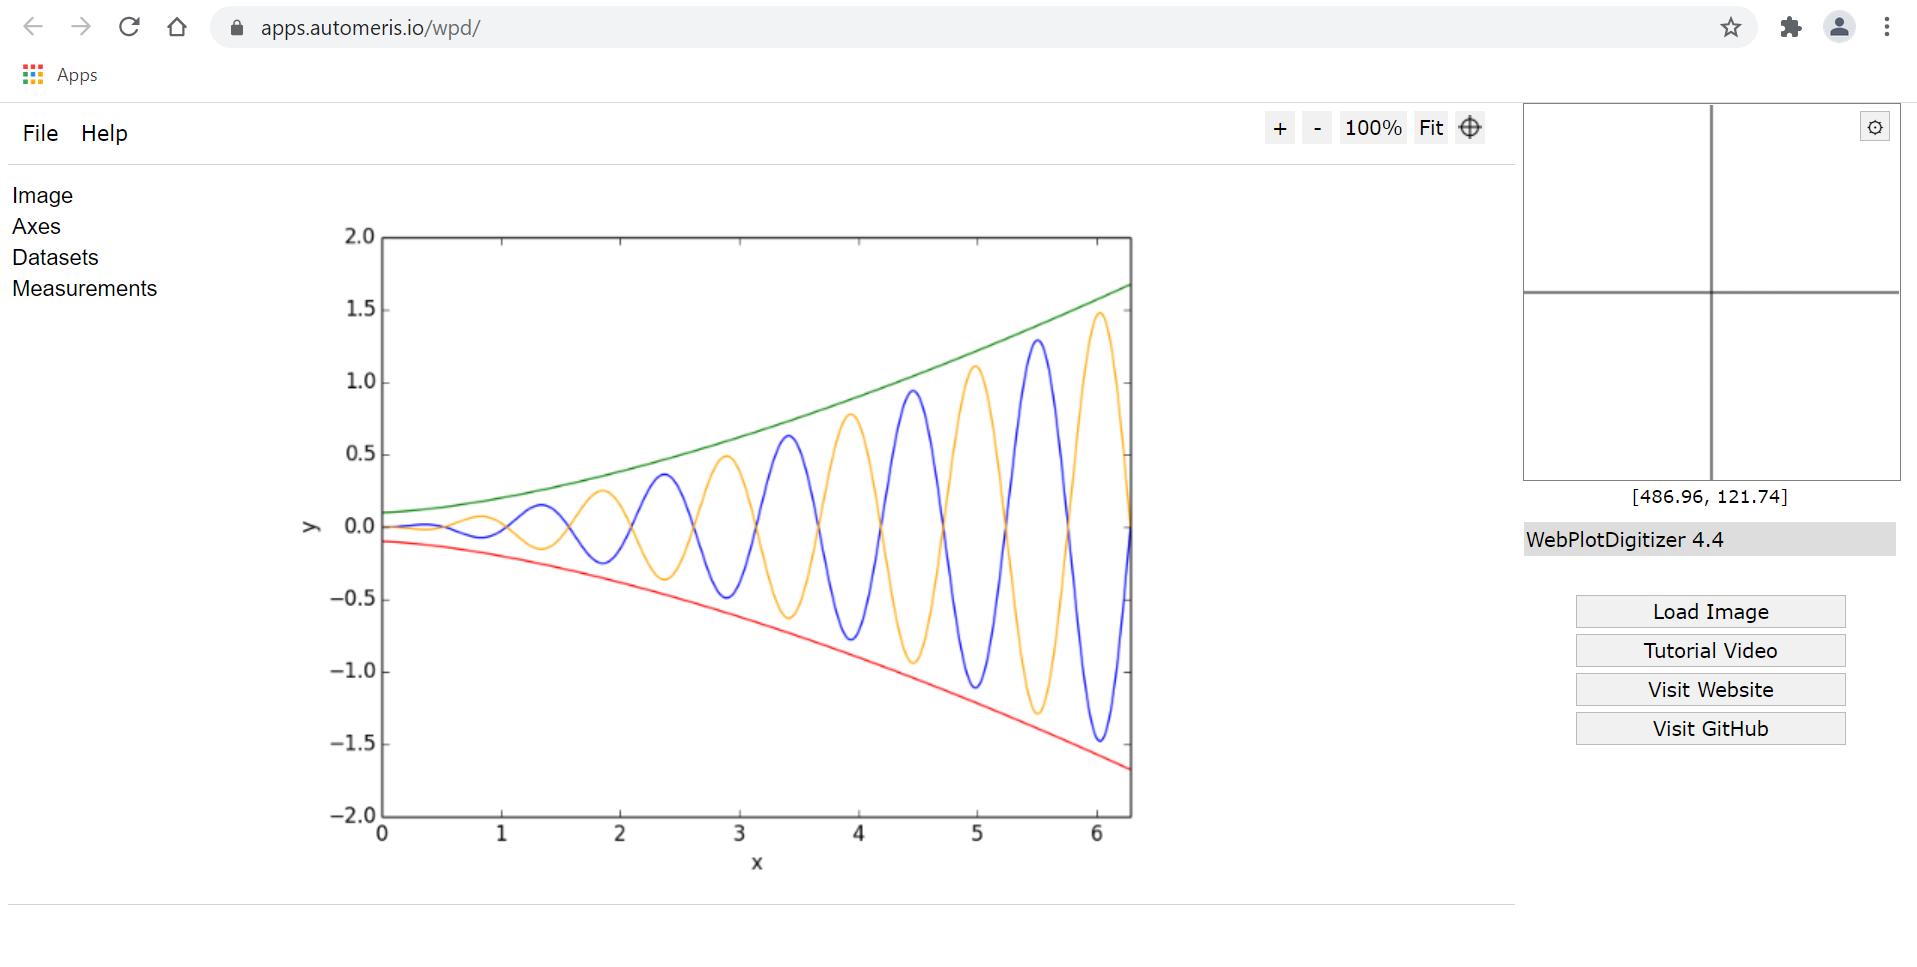
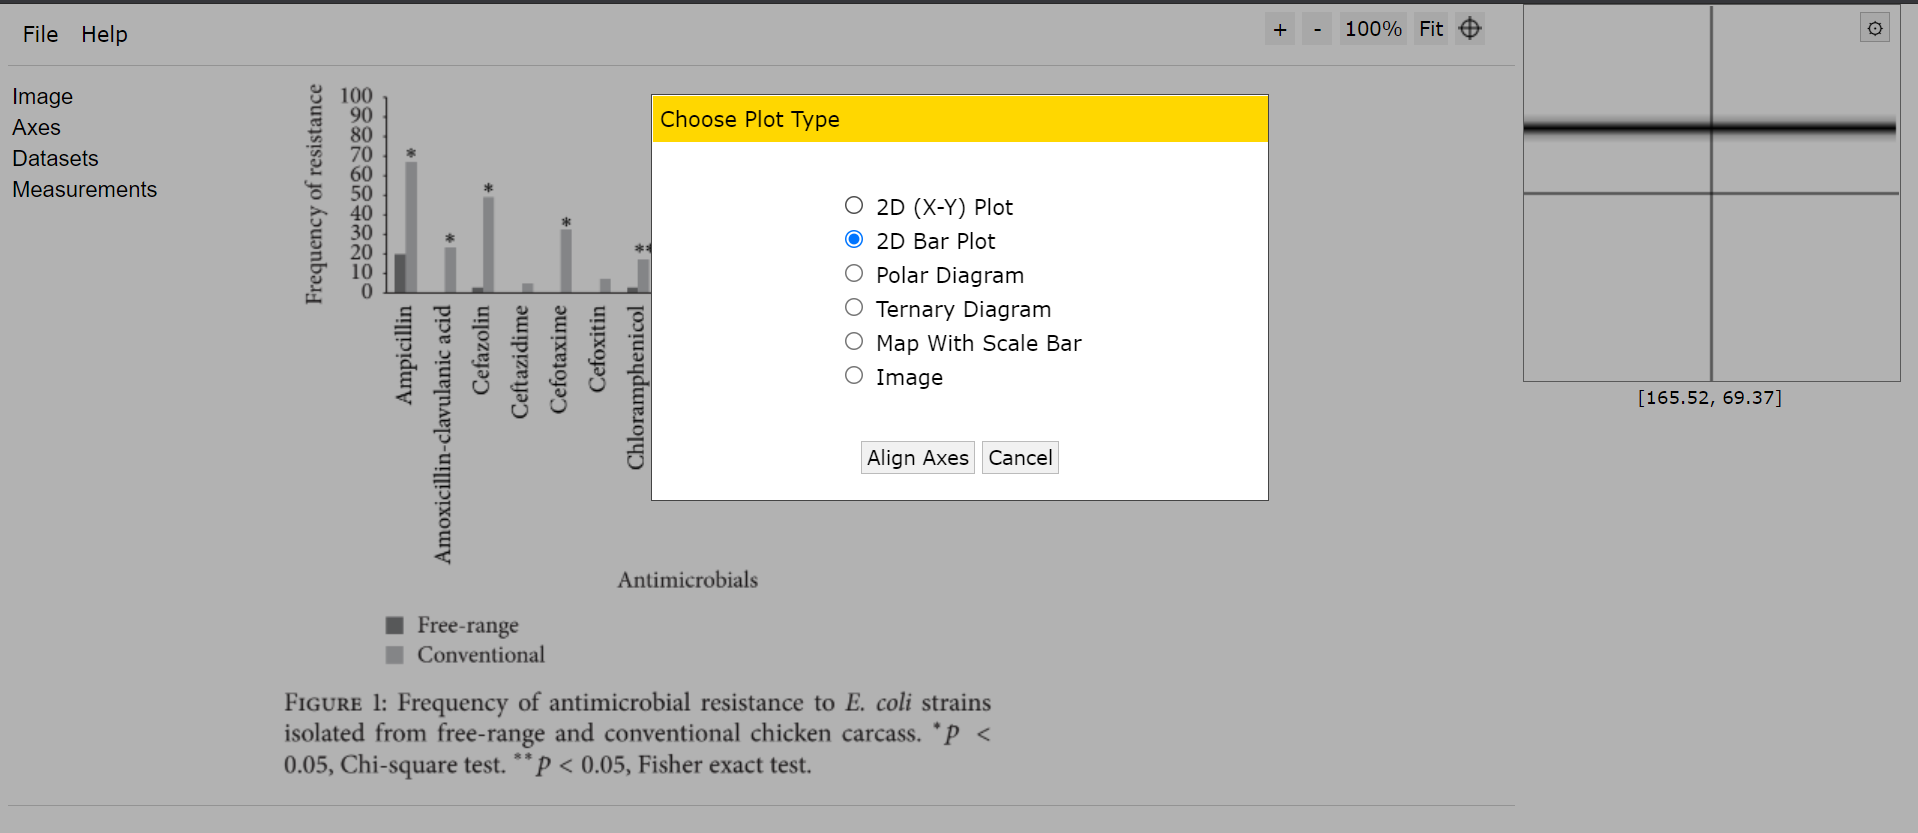
Under “File” at the top left corner, click “Load Image(s)”. Select the screenshot image file (.png or .jpg file types) of the figure(s) you want to extract. After selecting the image file(s), you will be asked to select the type of graph.
After selecting the type of graph, you will be shown how to calibrate the figure.
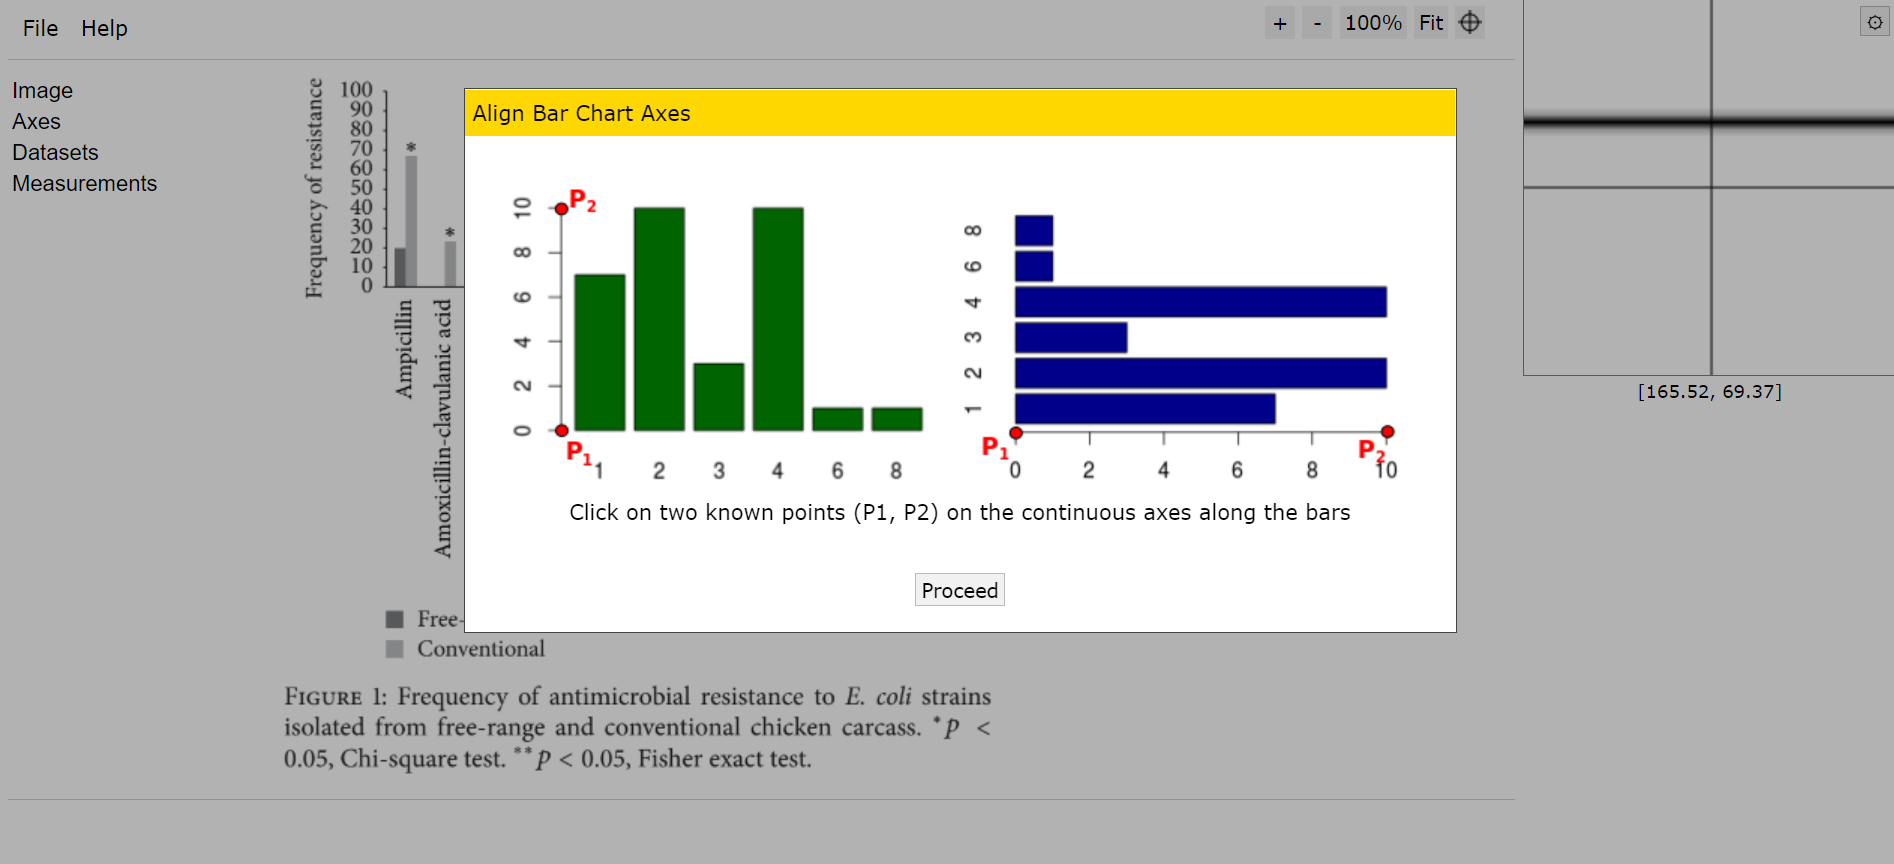
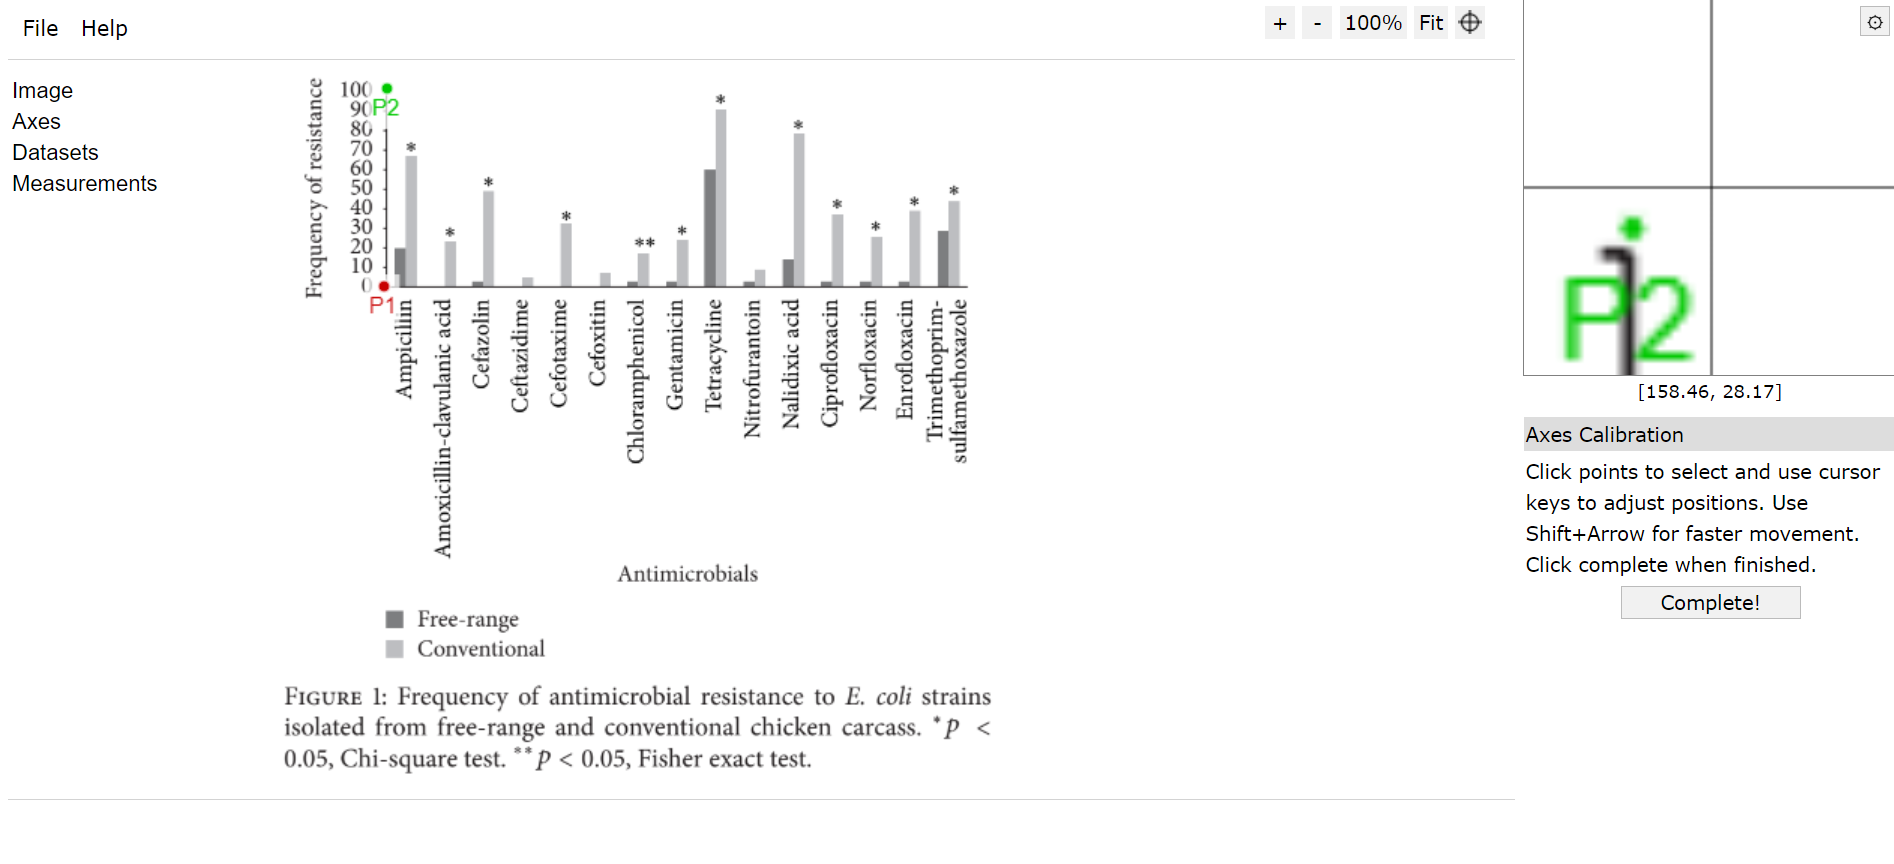
Click the points on the axes, then fine tune using the arrow keys on your keyboard.
To calibrate a scatterplot, 2D(X-Y) Plot should be selected and both axes require 2 data points to be added.
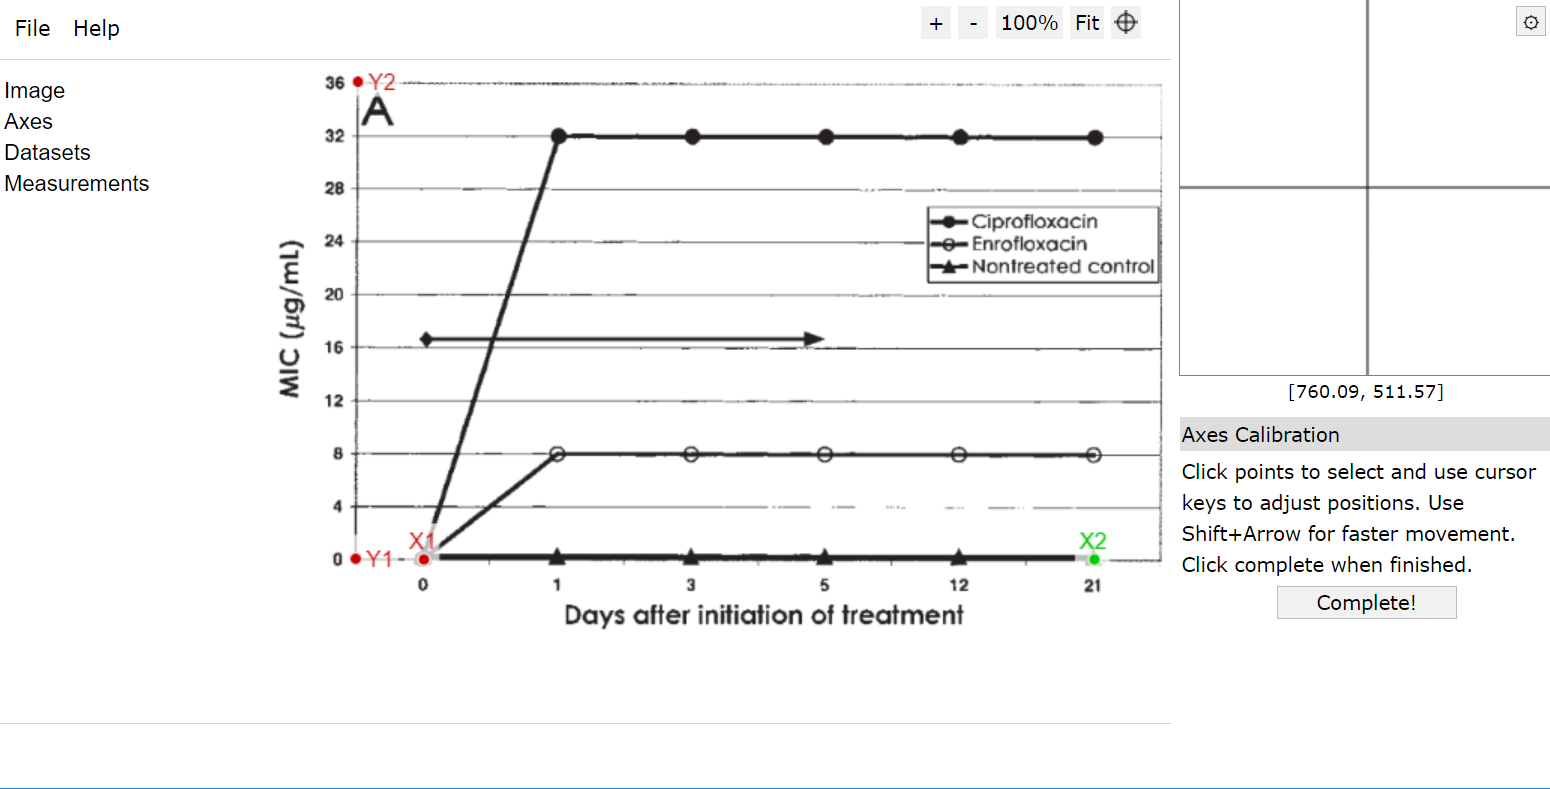
You will be asked to enter the values of the points chosen.
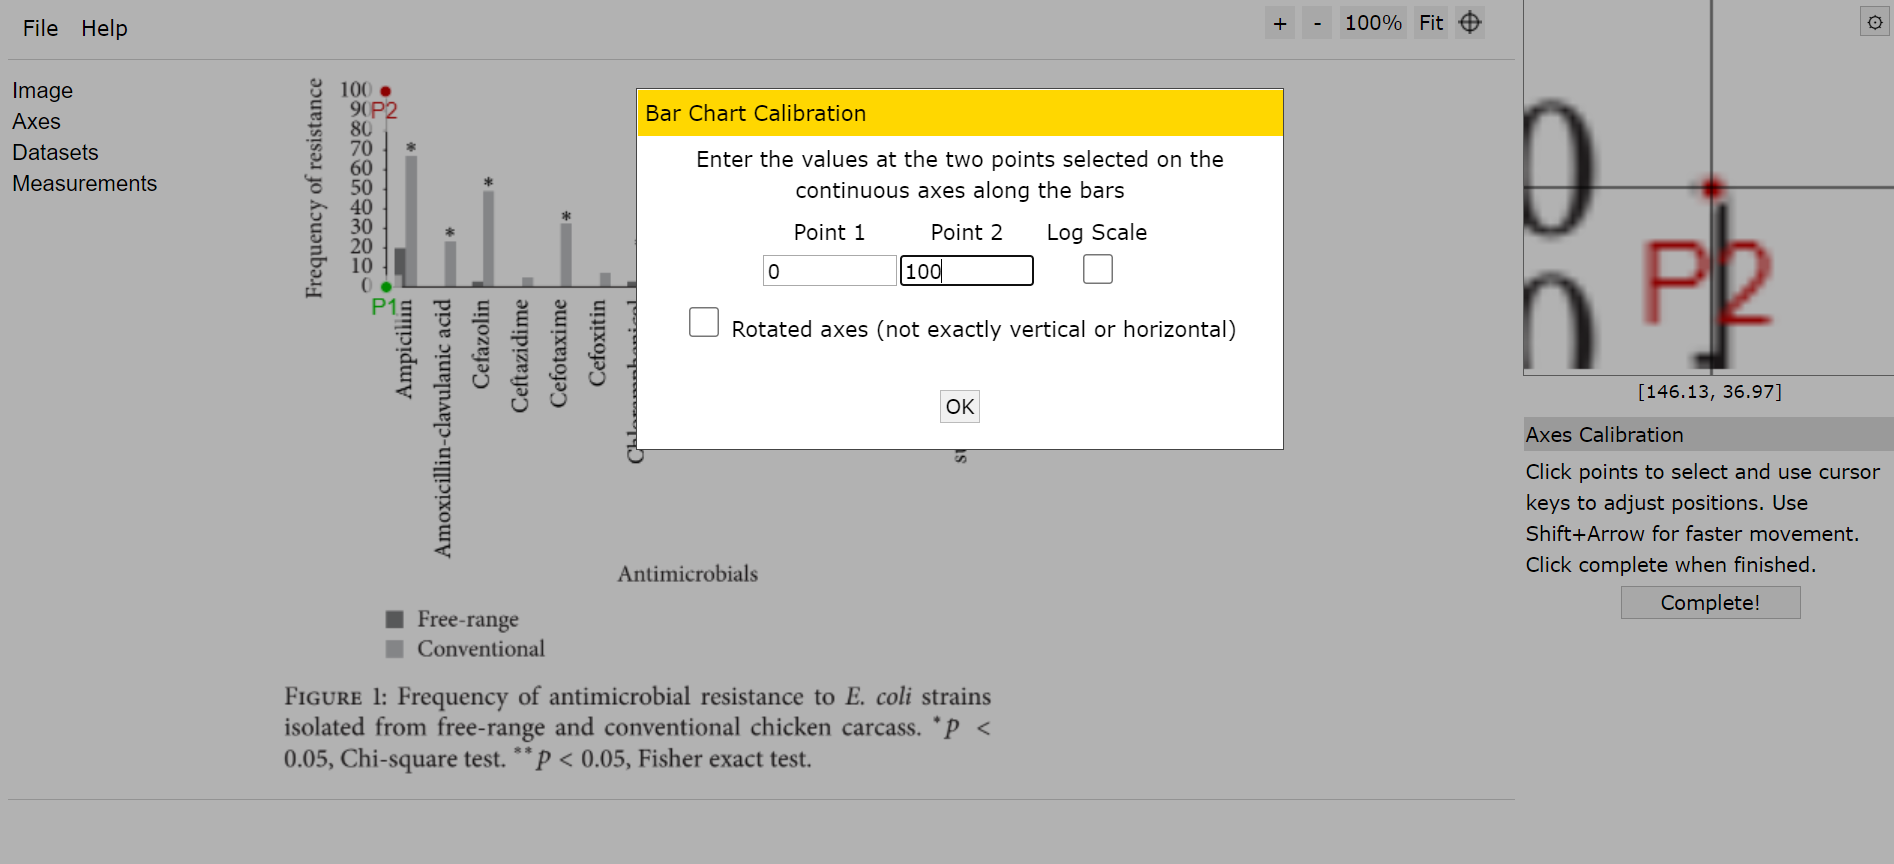
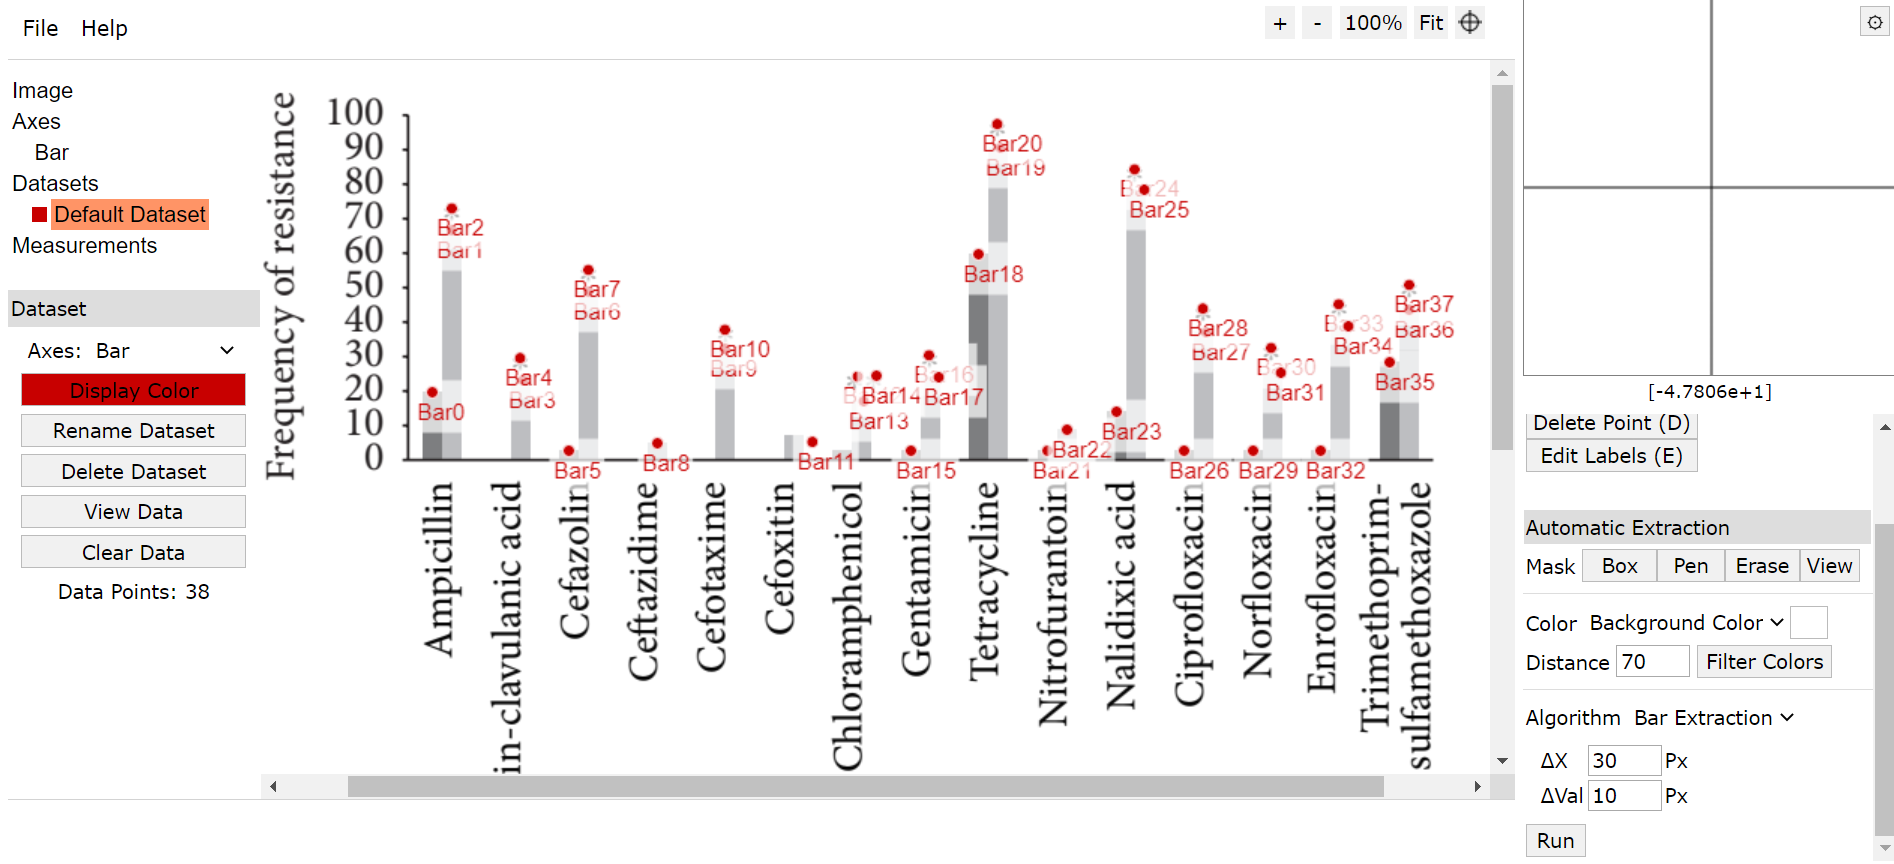
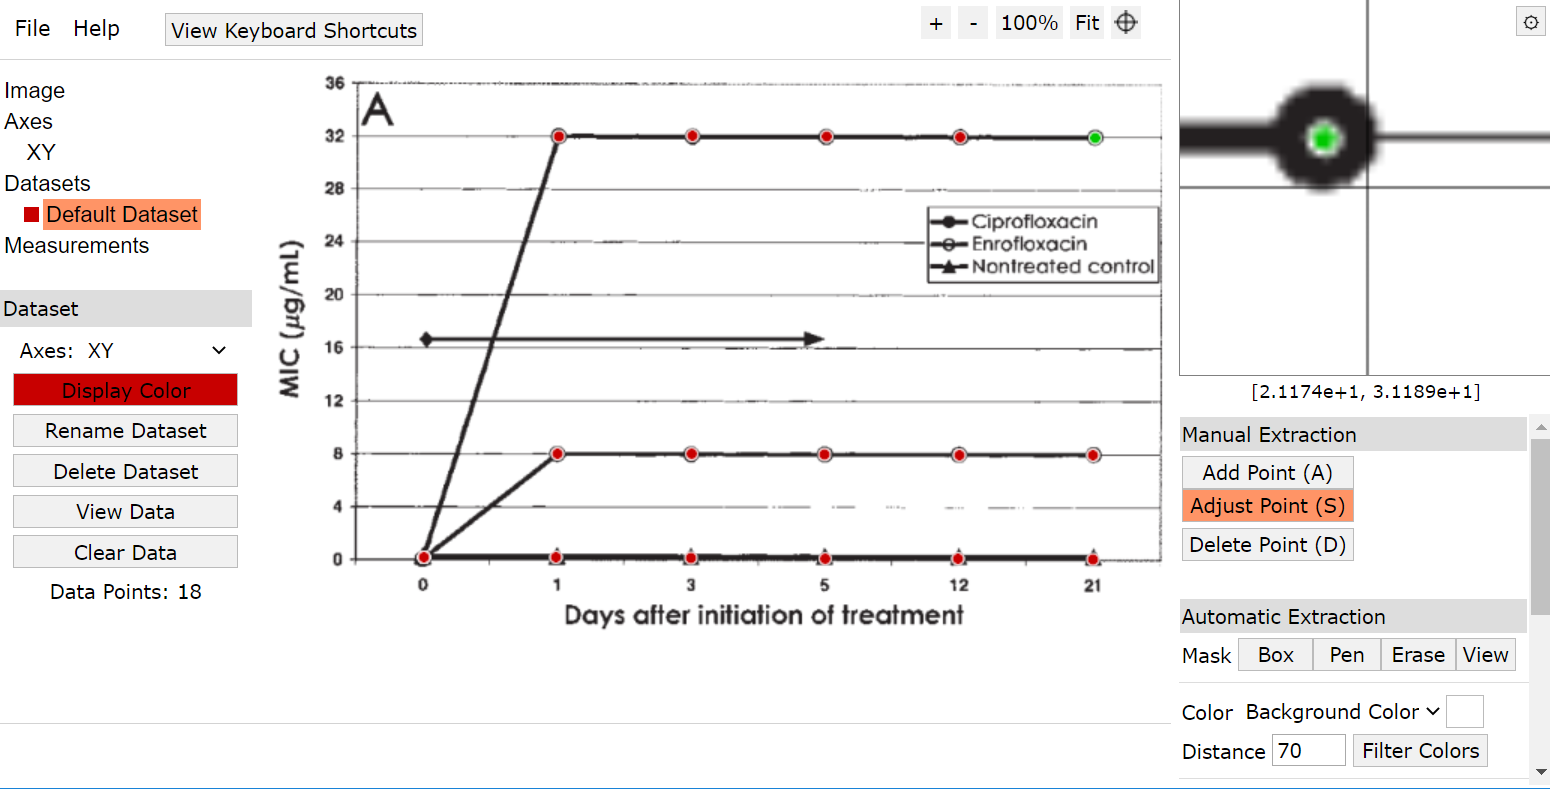
For this example, the image was magnified by using the “+” button at the top right corner. On the right side of the screen is the data extraction where automatic extraction can be used first. For figure like this example where 2 colours are used, change colour from foreground to background and adjust the distance to detect smaller differences in colour (70 selected for this example). Click “run” at the bottom.

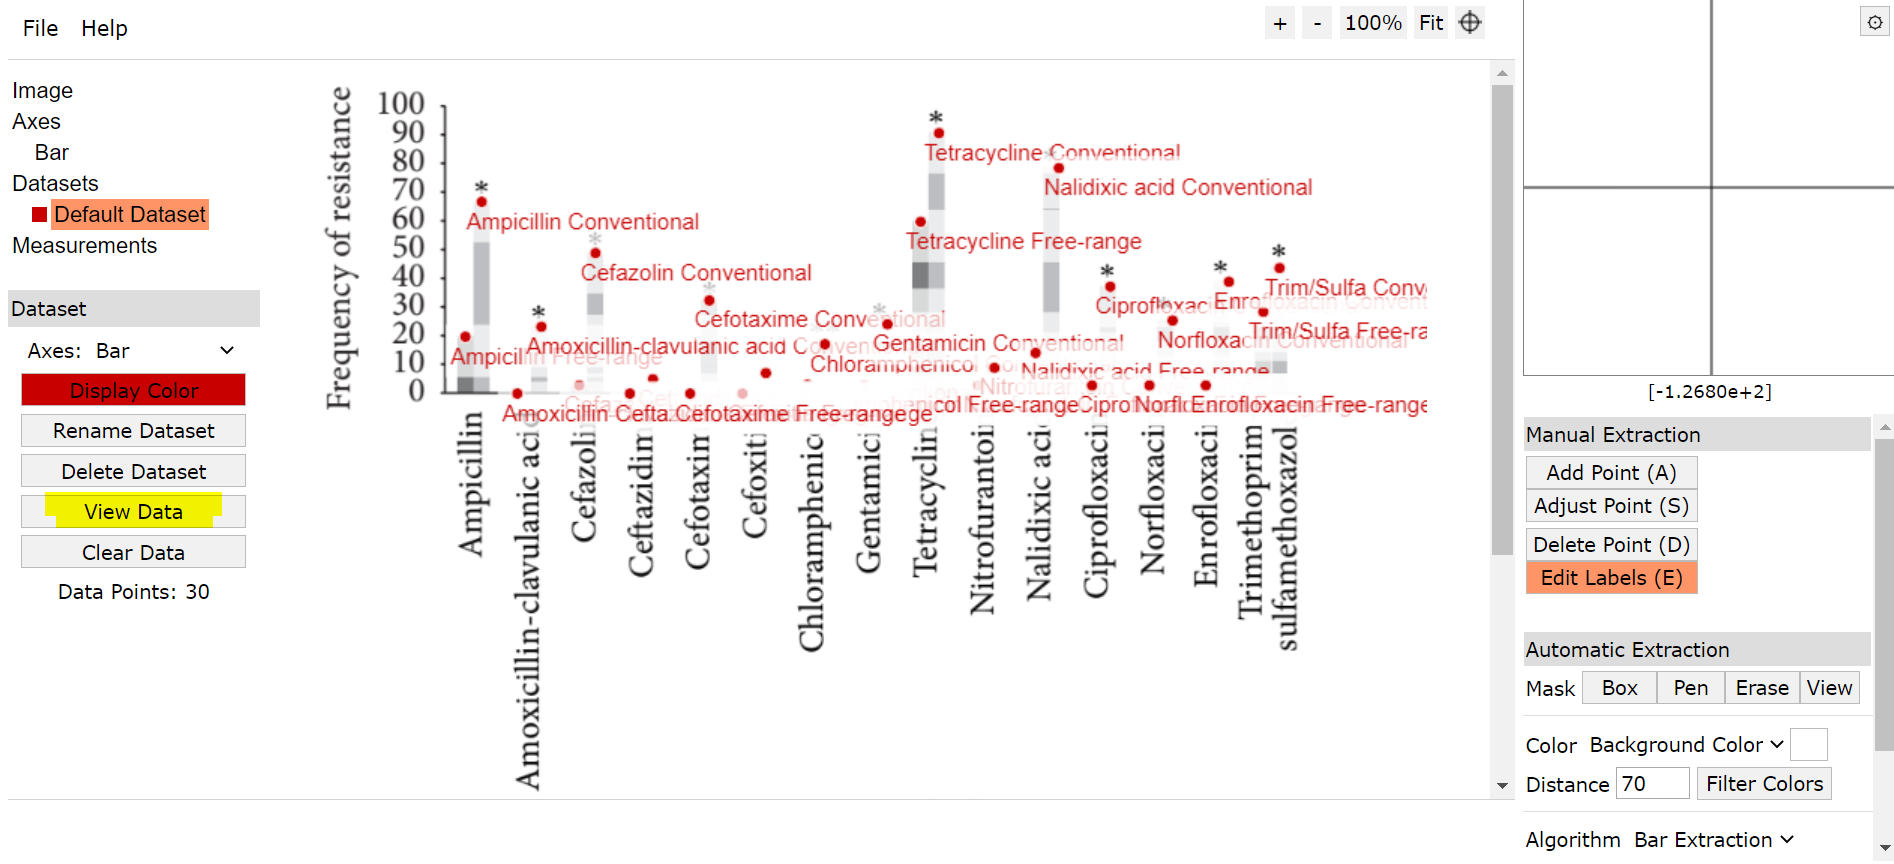
The manual method can be used to make adjustments as needed (in this example there are many extra points that require deleting).
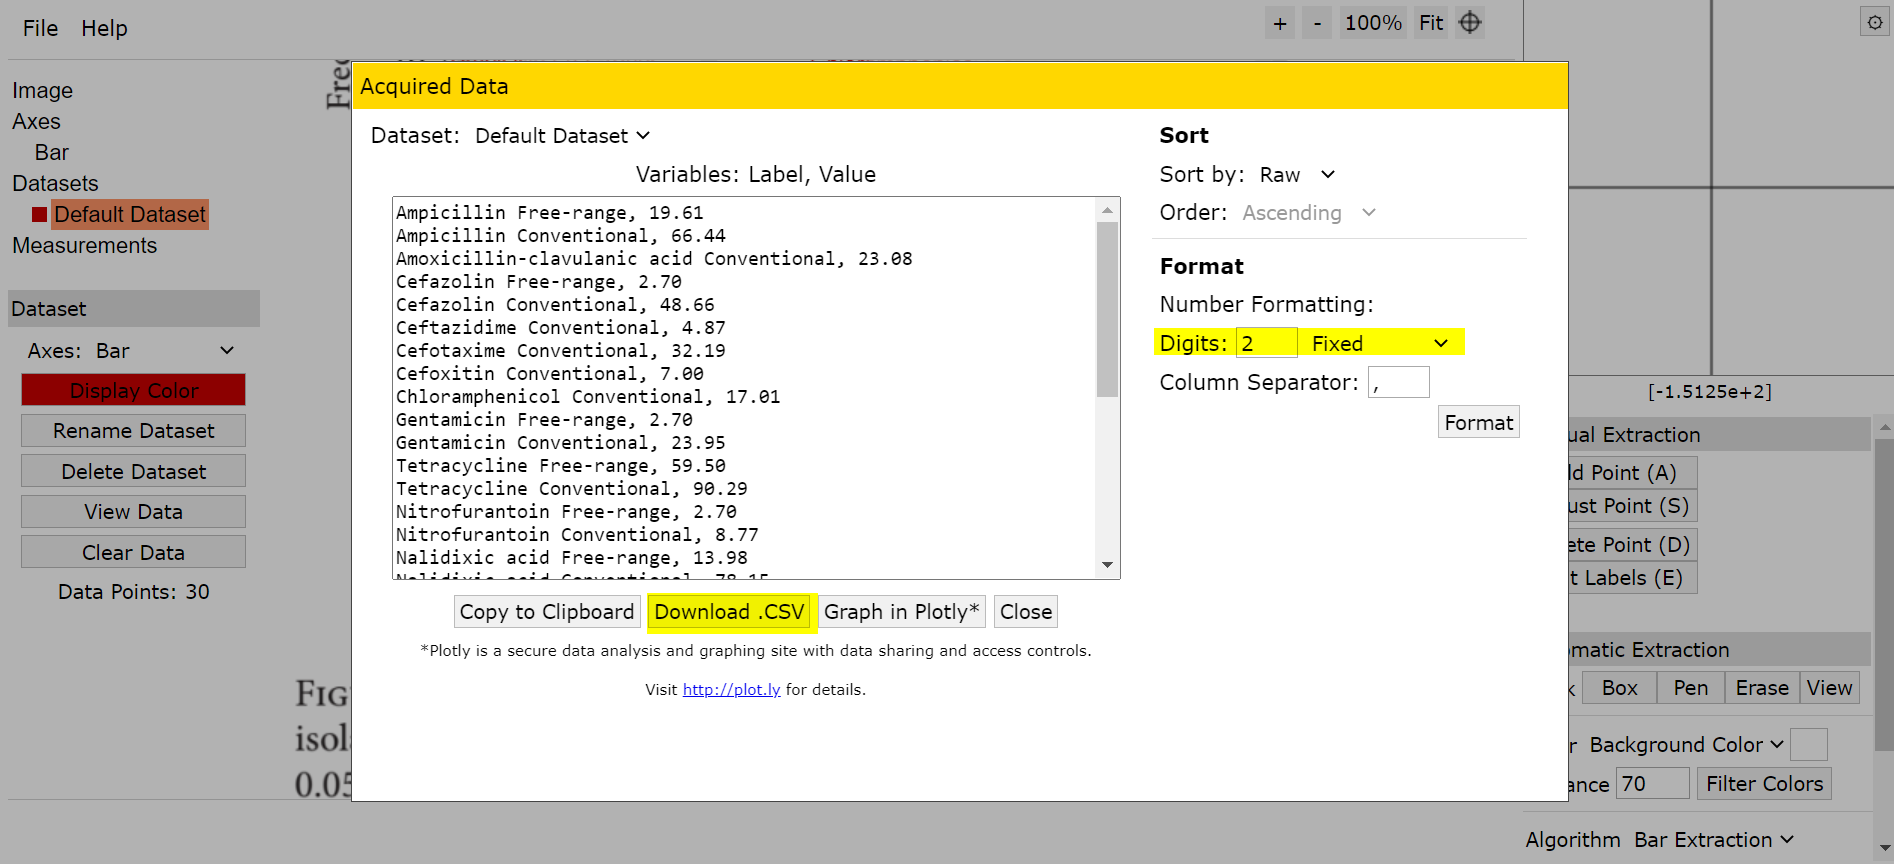
After editing labels, go to “View Data” where it can be exported as a csv file.
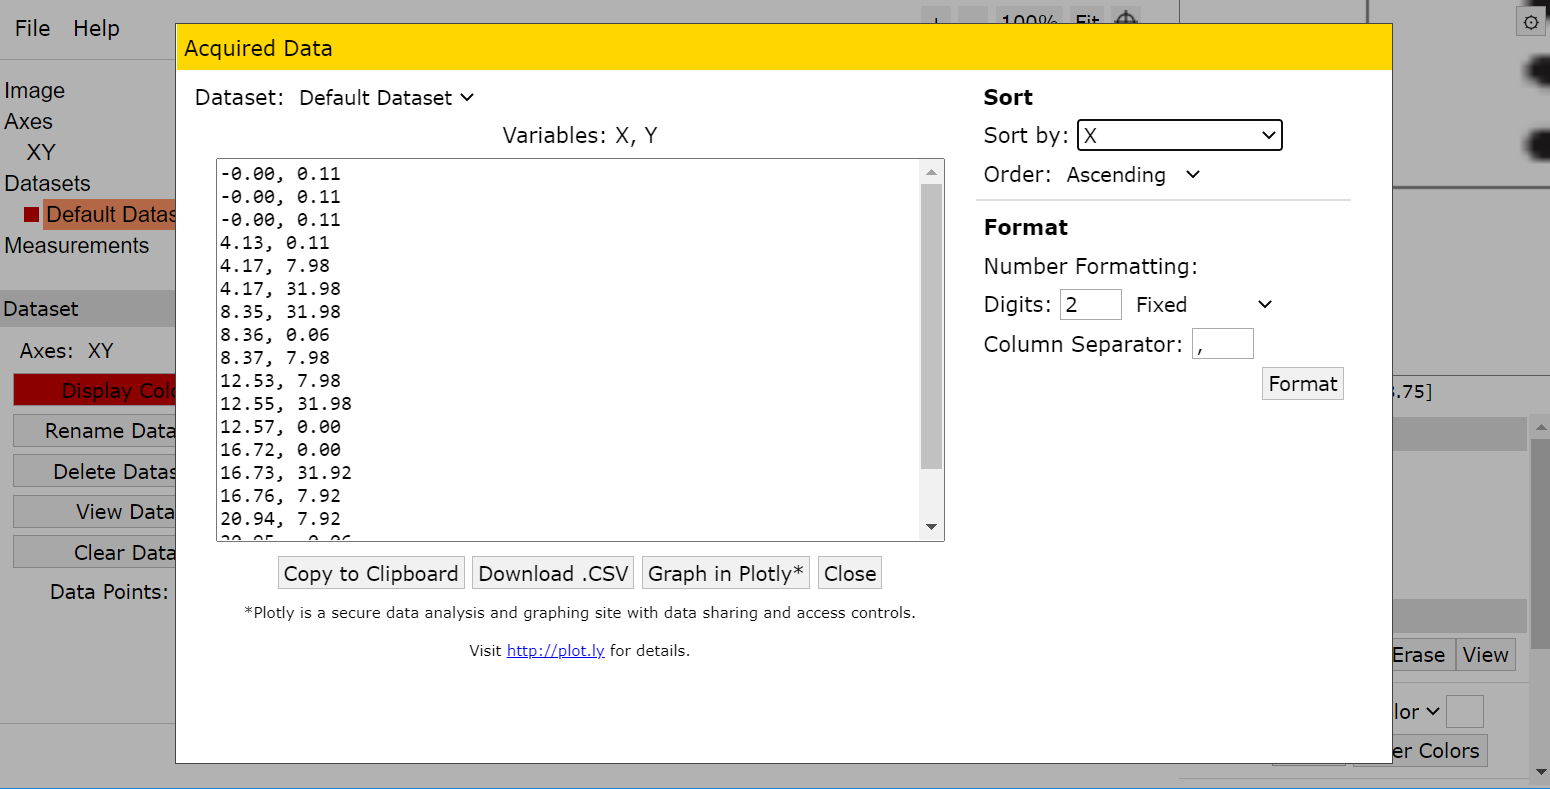
When extracting data using the 2D (X-Y) Plot method, you will notice that there is no option to edit labels.
The number formatting can be adjusted to 2 decimal places by entering 2 for digits and selecting “Fixed” from the dropdown menu. The data can now be downloaded as a csv file.
Since you cannot add labels for the 2D (X-Y) Plot option, it may be useful to sort the data by x value. Order can be left as ascending. Note that the x-axis cannot be properly calibrated with the irregular intervals between the days for scatterplots like the on in this example. Only y-values will be used for the figure extraction.
3.1.6.1. 3D Plots
It is not always feasible to extract 3D plots. WebPlotDigitizer can only extract from a 3D plot when the axes are in the same plane as your computer screen, or where the 3D bars are flush against the front and back of the axis. For example, the figure below can be extracted by manually selecting points, ideally from the top left corner of each 3D bar.

Extractable 3D Plot. From Figure 1 in “Decontamination treatments can increase the prevalence of resistance to antibiotics of Escherichia coli naturally present on poultry” by Capita et al., 2013. doi: 10.1016/j.fm.2012.11.011.
However, WebPlotDigitizer is unable to extract 3D plots with distorted perspectives, i.e. where the axes are offset (putting a space between the axis and the bars). Plots like those shown below are thus excluded from extraction.

Non-Extractable 3D Plot. From “Changes in Antimicrobial Susceptibility of Native Enterococcus faecium in Chickens Fed Virginiamycin” by McDermott et al., 2005. doi: 10.1128/AEM.71.9.4986-4991.2005.
Tip
For more on how to use WebPlotDigitizer tutorials can be found here https://automeris.io/WebPlotDigitizer/tutorial.html and the user manual can be found here https://automeris.io/WebPlotDigitizer/userManual.pdf.
3.1.7. Resistances and MDR
All factors related to antimicrobial resistance should be extracted, including those related to non-traditional antimicrobials (e.g. ionophores, coccidiostats, and metals). They should be extracted as finely as possible where specified (e.g. ceftiofur-resistance, rather than third-generation cephalosporin resistance).
Multi-drug resistance (MDR) should not be extracted, because the specific combination of resistances is impossible to compare to across studies/situations. However, if you are presented with MDR data, it may be possible to tease out antimicrobial-specific data. Before you do - ensure that the individual antimicrobial data For example, imagine that ‘X’ and ‘Y’ number of isolates were tested for each ‘Poor’ and ‘Good’ producers, as in the study below:
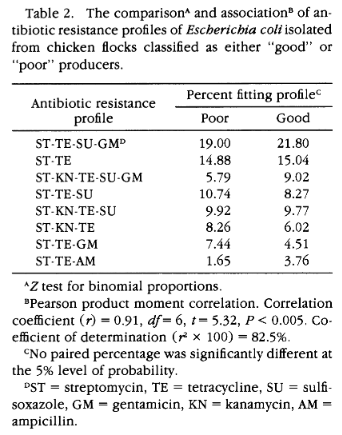
An example of an MDR table using prevalences from Spears (1990).
We can tease out this information by adding up the occurence of resistance across all profiles, to calculate the number of resistant organisms.
| Antimicrobial | AMR+ in Poor Producers | AMR+ in Good Producers |
| GM | (0.19)(X) + (0.579)(X) + (0.744)(X) | (0.218)(Y) + (0.902)(Y) + (0.451)(Y) |
| SU | (0.19)(X) + (0.579)(X) + (0.1074)(X) + (0.0992)(X) | (0.218)(Y) + (0.902)(Y) + (0.827)(Y) + (0.0977)(Y) |
| AM | (0.0165)(X) | (0.0376)(Y) |
3.1.8. Multiple Measurements
Often, factors may be assessed at multiple time-points. For example, swine may be sampled for resistant organisms at birth, weaning, growing-finishing, and again at abattoir.
As a general rule, where the allocation and observation stages are the same, the Measurement Closest to Human Exposure or MCHE should be extracted.
Where the allocation and observation stages differ, the MCHE within the allocation stage should be extracted (if available). These rules, and their exceptions, are described below.
3.1.8.1. Multiple Measurements at a Single Stage
Where multiple measurements are available at a single production stage (i.e. the allocation and observation stages are the same), the measurement closest to human exposure should be extracted, except
… where there are missing or unavailable data at the time-point closest to human exposure
Example
Resistance was assayed at days 10, 20, and 30 of production for the exposed group, but only at days 10 and 20 for the referent group.
Day 20 is extracted.
where the time-point is not applicable to the Canadian context
e.g. a measurement at >36 days into broiler production, past the point of harvest in Canadian industry.
3.1.8.1.1. Multiple Measurements at Farm
Where multiple measurements are available at the on-farm stage for cattle and swine, a measurement should be extracted at the end of each production sub-stage. This includes the following:
- Cattle
- Stage 1
- Stage 2
- Swine
- Stage 1
- Stage 2
See the production basics section for more information.
Multiple Measurements at Multiple Stages
3.1.9. Sample Type
Where individual fecal samples are available, those are preferable to pooled samples. When a pooled fecal sample can’t be taken directly from the animal, the goal is to obtain the equivalent of a pooled fecal sample. Extract litter/barn floor samples and not water/feed/dirt samples.
3.1.10. Provisional Rules
- Genomic data – record if AMR prevalence given + note what gene in description (can leave AMR dropdown empty – tetA and tetB are available in AMR dropdown though!), otherwise make a note (eg, CFU/g, gene copies, etc.).
- Salmonella species – combine if AMR prevalence given for more than one Salmonella species
3.2. Common Concerns
What do I do if …
… there are no factors to extract
If there are no factors to extract, indicate this using the notes field, and skip the reference.
… I’m confused about how to extract a factor
If you’re confused about a factor, reach out on Slack for clarification. Additionally, add a note to indicate why the factor was extracted in that way.
… an item I need is missing from a dropdown
If an item is missing from a dropdown (i.e. a non-free-text field), reach out on Slack. If the decision is made to use an alternative item in the list, add a note to justify this replacement.